A METAR map is a custom-made map with LED lights positioned at selected airports or reporting stations. The lights change color to indicate weather conditions based on METAR reports via internet. I’ve wanted to make a METAR map for a few years and finally took the plunge, and I’m thrilled with the results.
Creating a map is not difficult and requires only basic tools (scissors, electric drill, hot glue gun). No computer programming knowledge is necessary and configuring the lights is easy.
If you’re curious about METARs and the process to make your own map, read on!
What is a METAR?
METAR is a French acronym for Météorologique Aviation Régulière; the English translation is Meteorological Aerodrome Report. Take your pick. Either way, METAR is a format for reporting weather observations. METARs are typically issued every hour, usually more often, by many airports and a few non-airport reporting stations.
ASOS (Automated Surface Observing System) or older AWOS (Automated Weather Observing System) stations automatically collect the data used in METARs. Humans are still an important part of the process. Local observers (like control tower personnel) can augment the automated reports with information the machine can’t see, like funnel clouds or distant lightning.
ASOS data collection sensors at Elko Regional Airport (Wikimedia Commons)
METAR Example
Here’s a METAR from my home airport, Bowman Field in Louisville (KLOU): KLOU 041653Z 35006KT 10SM BKN038 03/M05 A3033 RMK AO2 SLP273 T00281050
METARs look awful at first, but with a little practice they aren’t difficult to read. They all follow the same format. Here’s the decoded observation from the above METAR:
KLOU Decoded Observation: Time Stamp: 4th day of January, 1653z (UTC Time) Wind: 350° at 6 knots Surface visibility: 10 statute miles Clouds: Broken cloud ceiling at 3,800 ft Temp / Dew Point: 3°C / -5°C Altimeter: 3033 inHg (US reports inches of mercury; most countries use millibars) Remarks: Type of station: AO2 (an AO2 station can detect precipitation type) Sea-level Pressure 1027.3mb Temp/Dew point in tenths: 2.8°C / -5.0°C
Lexington, Kentucky METAR displayed in-flight on an Avidyne IFD540 GPS Navigator
Non-Airport METARs
METARs are also issued at a few non-airport reporting stations. My favorite is Mount Washington Observatory, New Hampshire; elevation 6,288 ft (METAR ID: KMWN). Mount Washington boasts some of the most extreme weather in the country. I pulled up the KMWN METAR as I was writing this and was not disappointed:
KMWN Decoded Observation: 01/04/2024 at 1547z Winds 270° at 39 knots (45 mph) gusting to 44 knots (51 mph) Light snow showers, freezing fog, blowing snow Indefinite ceiling with vertical visibility: 0 feet Temp/Dewpoint: -11.0°C ( 12°F)/-11.0°C ( 12°F) Remark: Very light icing
In other words, typical gorgeous day atop Mt. Washington! Years ago, when we first had access to live, inflight METARs, I would have fun with my first officers by pulling up Mt Washington’s METAR. I’d point at it and say: “wow, check out the latest weather at [our destination].” Always good for a laugh to break up the boredom on a long flight.
Who uses METARs?
By number, pilots and dispatchers are the primary consumers of METARs. The weather observations in METARs provide pilots with the information to determine what takeoff or landing procedures should be used. There are times when a METAR will indicate a takeoff or landing cannot be safely made. Pilots often “refresh” METARs when approaching an airport with poor weather to monitor trends and have the most current decision-making information available.
Airline dispatchers read and speak fluent METAR. Dispatchers monitor origin, destination, and alternate forecasts and METARs for all their active flights. If weather at a destination or alternate changes unexpectedly, the dispatcher contacts the flight crew to work out a safe plan.
Weather hobbyists (like me!) enjoy monitoring METARs for the fun of it (I’m a hoot at parties). Weather nerds like to watch the changing observations during severe weather.
Meteorologists Use METARs
I asked WAVE TV Louisville Meterologist Ryan Hoke how he uses METARs.
Ryan Hoke
Most Meteorologists use METARs just about every day. Our predictions are only as good as our current view of the weather, so we rely on radar, satellite, and, of course, METAR observations to paint that picture for us.
While knowing the temperature, dew point, and wind speeds from METARs are great for day-to-day use, it’s the more extreme weather events that make METAR data exceptionally useful. Wind gust speeds from METARs during a High Wind Warning event, like we saw on March 3rd, 2023 in Louisville, KY, helped meteorologists guide the public through a life-threatening situation. Every few minutes we were able to see incredible wind gust numbers come in from the Louisville Muhammad Ali International Airport’s ASOS site, providing METARs that showed 79 MPH wind gusts. This, along with METAR reports from other ASOS sites, allowed us to communicate to the public in almost real-time, that hurricane-force gusts were occurring. Thanks to the somewhat recent introduction of 5-minute METAR data updates, meteorologists no longer have to wait for the top of the hour to get the latest reports. This is a far-cry from when I had to make telephone calls to nearly a dozen airport ASOS sites to make a temperature map for TV, as now most airports are online and participate in 5-minute data output. With that in mind, the traditional hourly updates are still very useful, especially at ASOS sites that are paired with a human FAA weather observer, much like at Louisville’s airport.
Observer remarks in METAR data include sightings of lightning, tornadoes, and precipitation types, which are very useful for helping meteorologists confirm reports of severe and winter weather. Oftentimes we see these more rare METAR remarks and extreme observations posted to the National Weather Service Slack chat room since NWS both manually and automatically posts the METAR texts of these reports when certain criteria are met.
In short, METARs seem so basic when you consider how far we’ve come with satellites, radars, and weather modeling, but without them the world of meteorology would fall apart!
The FAA and National Weather Service have interactive tools for finding METARS. The FAA’s Surface Weather Observation Stations tool is an easy way to find observations and METAR IDs by state or territory. https://www.faa.gov/air_traffic/weather/asos
If you already know the METAR IDs (or have a list of favorites) they can be displayed on the NWS Aviation Weather Center METAR page: https://aviationweather.gov/data/metar. The good news is that you don’t have to worry about decoding the observations, because the tool has a “Decode” option that displays the weather in an easy-to-read format.
If you plan on reading a lot of METARs, take some time to learn the abbreviations and acronyms. Most are easy to remember. The Aviation Weather Center has a page to help with decoding METARS.
METAR Maps
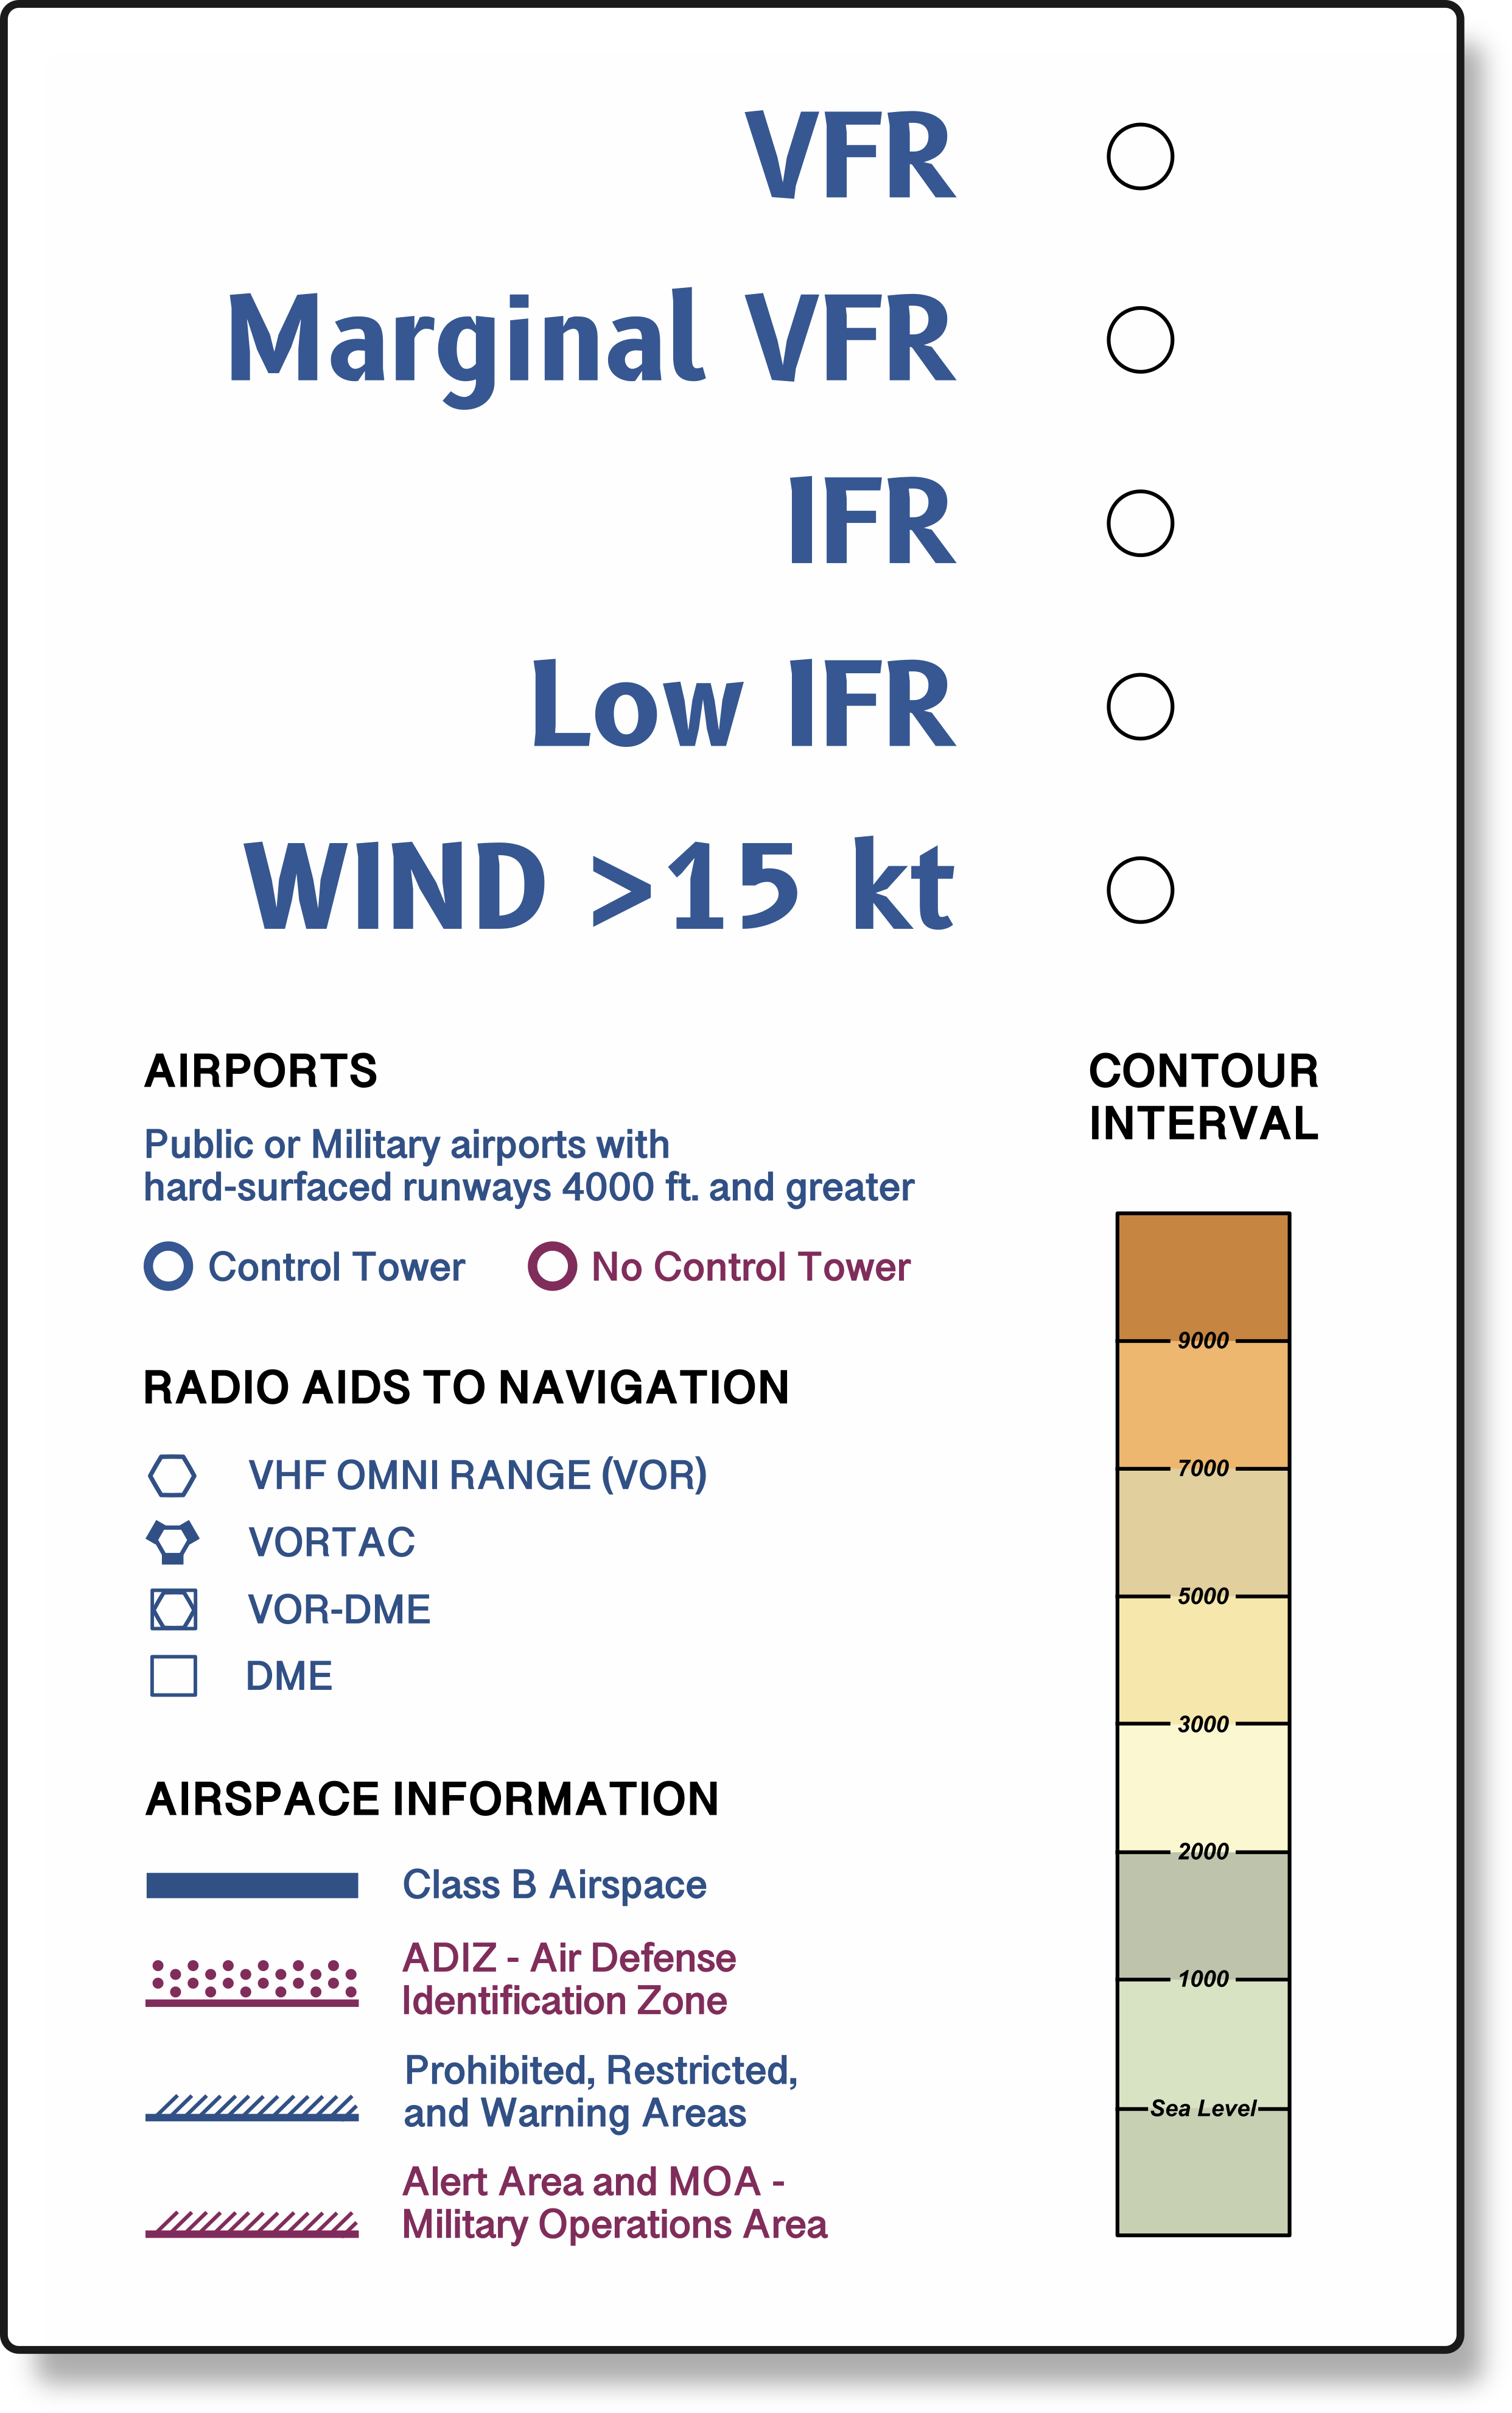
A METAR map uses LED lights to display basic flight conditions at a reporting station (usually an airport). Early generation maps displayed four colors that correlate to the four basic flight categories. Only two elements of the METAR were used: cloud height and visibility.
Green – VFR (Visual Flight Rules) Ceiling > 3,000 ft. Visibility > 5 mi
Blue – MVFR: (Marginal VFR) Ceiling 1,000 to 3,000 ft and/or visibility 3 to 5 mi
Red – IFR: (Instrument Flight Rules) Ceiling 500 to < 1,000 ft and/or visibility 1 to 3 mi
Pink – LIFR: (Low IFR) Ceiling < 500 ft and/or visibility < 1 mi
Newer generation map software can incorporate more METAR elements. Windy conditions can be displayed by flashing yellow, while flashing white can indicate lightning. A bright blue flash is displayed during frozen precipitation (snow, sleet, freezing rain, etc). The added elements provide an interesting, dynamic display.
Choosing METAR Map Technology
The heart of any map is a small, internet connected system-on-chip computer. If you’re a tech hobbyist, you can build a map from scratch using a RaspberryPi or ESP8266 board. So, if you have an old RaspberryPi laying around, you’re halfway there. Lights and connectors can be sourced on Amazon. Open source software is available at Github. I wasn’t interested in that much adventure, so I looked for a pre-programmed, ready-to-assemble kit.
There are several vendors that sell kits and finished maps. After comparing options, I narrowed my search to DIY Metar (diymetar.com).
DIY Metar is a family business that sells both kits and custom made, fully assembled maps. Unlike some of their competitors, DIY Metar maps need no subscription or annual fee. The owners, Alexander and Haley from Lakeland, Florida, were enthusiastic and responsive to my pre-purchase questions, making my purchase decision easy!
I bought their 100-light DIY Metar kit. The box includes two 50-light, addressable LED strings, a pre-programmed hub (controls lights and retrieves METARs via WiFi), USB power cube, and stickers to make a virtual LED legend. Most important, my purchase came with plenty of friendly customer support.
DIY Metar 100 light kit includes two 50 light strings, hub, charge cube, cables, stickers, instructions
Disclosure
I received no payment or goods in exchange for mentioning DIYMetar.com in this article. The owners were unaware that I was writing this piece until I asked them to proof-read for accuracy. I’m impressed with their products and service; I think their business is worth recommending to my readers.
Testing the Kit
After unboxing my new kit, the first task was connecting the two strings to the hub and plugging it in. As expected, I had one hundred bright LEDs running through the brief test cycle.
Power on self-test of the DIY Metar hub and 100 lights
Designing the Map
I decided to include all Kentucky airports with weather reporting, then expanded to a 135 mile radius around our home airport (about an hour flight time in our Cherokee Six).
The actual map is the FAA’s U.S. VFR Wall Planning chart. The DIY Metar website has the Planning Chart available for download. However, the most current version of the chart is found on the FAA’s digital products page. Click the “Planning” tab, then download the PDF or Tiff file (whichever format you’re more comfortable editing). The files are quite large.
The Wall Planning chart is great for maps covering large areas. On the other hand, if mapping a small region (e.g., the Chicago area), sectional and terminal area charts can be downloaded and used to provide more detail.
You’ll need basic graphic editing skills and software to crop and make minor adjustments to the image. If graphic editing isn’t your bag, DIY Metar can design a map centered around your favorite airport.
Reduced-size version of my photolab-ready map
I used my favorite open-source graphics editor (Inkscape) to add the 135 mile circle, outline of Kentucky, a fancy legend, and some shading; none of which are necessary for a stunning METAR map.
DIY Metar kits come with a couple of stickers to make adding a virtual LED legend easy. After the map is printed, place a sticker where you want the legend and drill the light holes.
If you’d like to use the virtual LED legend I designed for my map, links for two versions are below. The PNG file is ready to import into your graphics project. If you want to customize my version to suit your needs, the SVG file can be edited in graphics editors that support vector files (requires two fonts: B612 and Bangla Sangam MN).
Right-click the thumbnails and select a download option… Safari: “Download Linked File” Chrome: “Save Link As”
I placed a black dot on each airport that will have a light. Because some airports don’t issue METARs and others are close together, not every airport will have a light. The dots make it easy to locate the correct airports when punching holes.
Other Map Resources
Looking for a state METAR map? The Department of Transportation for several states provide high resolution aeronautical charts which could make excellent METAR maps. Wisconsin’s chart is a perfect example. Check your state’s DOT website for current charts; not all states have them. I did a quick Google search and found the following state charts. There are more states available.
Wisconsin State Aeronautical Chart
If you find a state chart not listed, let me know in the comments and I’ll add it!
Walgreens recommends saving files with a resolution of at least 200 PPI (Pixels Per Inch). PPI and DPI (Dots Per Inch) are equivalent. My map size is 30″ x 20″. So, at 200 PPI, my saved file should be at least 6000 x 4000 pixels for printing. A lower resolution may cause the map may appear blurry or pixelated. So, expect large maps to have large file sizes.
Once I was happy with my map, I upload the file to Walgreens and ordered a 20″x30″ poster print.
Mounting and Drilling Holes
I found others map-makers on the internet that glued the map to foam core board. Alexander from DIY Metar suggested I glue the map to mat board (available at craft and frame shops). Great suggestion! I sprayed both the map and mat board with adhesive and bonded them together. An old linoleum printmaking ink roller was perfect to assure a smooth finish. A Vinyl Application Squeegee will also work, but take care not to scratch or scuff the map.
Ink roller used for printmaking to smooth the map on the mat board.
The next step is punching holes. My map has 99 holes (I should have found an airport for that last light!). As recommended on the DIY Metar website, I ordered a Uxcell 7mm punch drill from Amazon. The punch shank is 11mm (7/16″) diameter and should fit in the chuck of a standard drill.
Drilling 7mm holes with the hole punch
I placed scrap mat board and plywood beneath my map to protect the table. The hole punch is razor sharp and easily cuts the holes at low RPM with a little pressure. After a few practice holes in scrap mat board, I cut 99 perfect holes in about 20 minutes.
Map with 99 perfect little holes
When the map is flipped over, it’s blank with a bunch of random holes. I labeled each hole with its airport code. To make labeling easy, I printed a small, reverse-image (horizontal flip) of my map so I could quickly identify each airport hole.
Using a mirror-image map to help locate and label holes
Installing the Lights
I’ve seen examples of mounting the lights using electrical tape and a hot glue gun. I started using clear duct tape (not a good choice). After mounting 10 lights, tape was already coming loose. The hot glue gun worked much better for me.
Dress Rehearsal
I tested the system after installing ten lights to make sure the hub, lights, and our WiFi were going to play together. I added the first 10 airports to the hub setup page and less than a minute after reboot, 10 green VFR airports illuminated. Time to install the remaining lights.
First 10 lightsSuccesful test
Now the fun part! Finding a path for the light string that hits each hole. It’s not terribly difficult. I thought ahead 4-5 holes at a time and sketched the path with a pencil. I was able to complete the lights in two sittings, about two hours with union coffee breaks. The next morning I went back with the hot glue gun and re-secured a few areas that popped loose.
Gluing the lights and writing down each airport as its light is secured.
The DIY Metar kit includes a worksheet to write down each airport ID as its light is affixed to the map. This is really important when it’s time to program the hub.
The photo below is the back of my completed map mounted to an inexpensive craft store frame. The closest light to the hub was a little too far for the supplied wire bundle, so I spliced in extra wire. I could have avoided that with a little more planning.
Kind of ugly, but no one will see it (but you)
Setting Up the Hub
DIY Metar Hub
The hub requires a comma-separated list of the airports in the same order as the lights were installed. With 94 airports plus the 5 lights for the legend, I wanted to make sure I entered them accurately. All codes must be in 4-digit ICAO format (KLAX instead of LAX). I typed them into a text editor (separated by commas), then tested by pasting the entire list into the NWS METAR page. The page happily crunched the string and spit out a list of METARs. I went through the list and noticed one METAR missing. I had typed a capital “i” instead of a number one in an entry. With that fixed, it was time to set up the hub.
The DIY Metar kit includes instructions to place the hub in setup mode (it’s easy). After connecting a laptop, tablet, or phone to the hub’s WiFi, setup is as easy as opening a webpage, entering your home WiFi settings, pasting the list of airports, and selecting a few options. In most cases the default settings will work fine. After hitting submit, the hub reboots, and within a couple of minutes the map displays current flight conditions!
Pics of the Completed Map
Completed mapOn the wallVirtual Legend
Pro-Tip:
Save the numbered airport worksheet! Tape it to the back of your finished map. In the event of a software glitch, the list will make setting up the hub easy.
The Map in Action
Photos of the METAR map don’t do it justice. In real life, the LEDs are bright and the colors are vivid. The map looks stunning in my office and is a fantastic conversation piece. Although not a weather briefing, it’s a fun way to visualize the area weather.
Frozen Precipitation and Windy Conditions
Snow reported at CVG (Cincinnati). Two bright blue flashes indicate frozen precipitation. Winds over 15 knots are indicated by flashing yellow lights.
Frozen precip reported in CincinnatiWindy conditions in Indy
Five hour time-lapse during a blustery, rainy day.
Station lights flash yellow when winds exceed 15 kts (customizable). I chose the default setting of 15 knots because the max demonstrated crosswind component of our Cherokee Six is 17 knots. If I see a yellow light, I need to take a close look at winds and runway alignment before driving to the hangar.
5 hour time-lapse loop
Areas of snow over Indianapolis and Dayton
Bright blue flashes indicate snow in the METAR reports. Compare the flashing lights with the areas of snow in the Foreflight radar image below.
Flashing blue lights indicate frozen precipitation in the METARRadar image of the snow reported in the above METAR map
Interested in building or ordering a METAR map? Do you already have one? Let me know in the comments. I’d love to hear about it!
There are pros and cons to each of the other software/hardware solutions out there. Thanks for this great article!
I’ve made a total of 7 METAR maps for myself and friends. The simplest software/hardware is the DIYMetar solution, by far. It works reliably and is well maintained by Alex. The particular “flat” LEDs he includes these days are excellent to work with…and I’ve tried several sorts of LEDs.
For tinkerers or hackers, I suggest a Raspberry Pi alternative at https://github.com/jcl-rv12is/METARMap, where you’ll also find a very detailed install document in a Word file at that location. That code is a fork of Philip Rueker’s excellent software. The functionality of this product, for me, is the gold standard.
For those more familiar with Arduino/microcontroller platforms, I recommend looking at https://github.com/jcl-rv12is/led-sectional, which is based on an ESP8266 board. That code is a fork of someone else’s work, to which I added (IMHO) improved functionality, bringing it pretty much in parity with the Pi solution.
Thanks for the great feedback! I really enjoyed working with the new flat LEDs supplied by DIY Metar. Super easy to work with, and it makes a nice, flat map that works with standard frames. I almost went the Pi route (I’ve done a couple of Pi projects), but decided I wanted to spend more time designing the map and less time learning about the software/hardware interface. It’s cool to have so many options available to build a map!
Many states publish State Aeronautical Charts. I found many simply by Googling “Kentucky State Aeronautical Chart” or similar. Also, go to your favorite state’s official website and look for their Department of Transportation or Transportation Cabinet section. That’s usually where you’ll find the state maps.
I could not be happier with the product and support that I received from DYI Metar Map.
Construction was fun and the customer support could not have been better. I made a map covering the entire state of Florida and am trying to decide on a second project.
Thanks! For my Kentucky map, I used the US Wall Planning chart (links in the article) and heavily edited the Kentucky area with Inkscape (and open source vector graphics program).
I also made a Kentucky map with a lot of southern Illinois, Indiana, and Ohio (I am out of KLUK) so that I can get a statewide weather view and also get a view of the next couple of hours for flying. I use the map all the time looking for lines of thunderstorms or snow events, as well as wind. My young adult kids also have learned to read the map to better make some their weather decisions – especially my son who has a nice car he doesn’t want in the rain. I used a deeper “shadow box” type frame which seems to be OK. I am going to rework my map with the lower profile LEDs and increase the density of the reporting stations. Cool tech…..
I am undertaking this project and want to reuse the legend you created to save time editing. Can you share? I plan to place it on the current version of the USA Wall Planning chart.
Hi Aaron, I just updated the article with links to my legend. I included a ready-to-use PNG and an editable SVG version. Let me know if you have any problems with the files. Thanks for the great idea!
This is amazing! I am so excited to build my own! I’m in florida by the space center so I’m right where Jax and Miami meet. Do you have a state map of Florida you can post, please?
Hi George. The Florida Department of Transportation has a really nice Florida chart. I added a link in the article. Here’s the direct link to the page. Click on “Florida Aeronautical Chart – 2025“
Is there any reason why you couldn’t use a poster board print from Walgreens, as opposed to using a poster paper print and gluing it to a foam/mat board? I feel like we can skip the gluing step if we print it directly to a poster board, but I’m not sure if there is a reason to not do that.
Hi there! Info for the legend lights can be found here, about halfway down the page: https://diymetar.com/faq
Short answer: Instead of entering airport codes for the legend lights, enter codes:
L1 = Vfr / Green
L2 = Mvfr / Blue
L3 = Ifr / Red
L4 = Lifr / Pink
L5 = Windy / Yellow


There are pros and cons to each of the other software/hardware solutions out there. Thanks for this great article!
I’ve made a total of 7 METAR maps for myself and friends. The simplest software/hardware is the DIYMetar solution, by far. It works reliably and is well maintained by Alex. The particular “flat” LEDs he includes these days are excellent to work with…and I’ve tried several sorts of LEDs.
For tinkerers or hackers, I suggest a Raspberry Pi alternative at https://github.com/jcl-rv12is/METARMap, where you’ll also find a very detailed install document in a Word file at that location. That code is a fork of Philip Rueker’s excellent software. The functionality of this product, for me, is the gold standard.
For those more familiar with Arduino/microcontroller platforms, I recommend looking at https://github.com/jcl-rv12is/led-sectional, which is based on an ESP8266 board. That code is a fork of someone else’s work, to which I added (IMHO) improved functionality, bringing it pretty much in parity with the Pi solution.
Fly safe!
Thanks for the great feedback! I really enjoyed working with the new flat LEDs supplied by DIY Metar. Super easy to work with, and it makes a nice, flat map that works with standard frames. I almost went the Pi route (I’ve done a couple of Pi projects), but decided I wanted to spend more time designing the map and less time learning about the software/hardware interface. It’s cool to have so many options available to build a map!
Do you know where to get the planning wall maps by state???
Many states publish State Aeronautical Charts. I found many simply by Googling “Kentucky State Aeronautical Chart” or similar. Also, go to your favorite state’s official website and look for their Department of Transportation or Transportation Cabinet section. That’s usually where you’ll find the state maps.
I am wanting to do the continental US with ~200 airports lit up.
I’m wondering if the Raspberry Pi Zero WH has enough power to drive that many lights.
John I have some questions about your repo. Can you reach out to me?
I could not be happier with the product and support that I received from DYI Metar Map.
Construction was fun and the customer support could not have been better. I made a map covering the entire state of Florida and am trying to decide on a second project.
That’s great! I really enjoy my map.
Where did you get this map with the highlighted state? It looks great.
Thanks! For my Kentucky map, I used the US Wall Planning chart (links in the article) and heavily edited the Kentucky area with Inkscape (and open source vector graphics program).
I also made a Kentucky map with a lot of southern Illinois, Indiana, and Ohio (I am out of KLUK) so that I can get a statewide weather view and also get a view of the next couple of hours for flying. I use the map all the time looking for lines of thunderstorms or snow events, as well as wind. My young adult kids also have learned to read the map to better make some their weather decisions – especially my son who has a nice car he doesn’t want in the rain. I used a deeper “shadow box” type frame which seems to be OK. I am going to rework my map with the lower profile LEDs and increase the density of the reporting stations. Cool tech…..
I am undertaking this project and want to reuse the legend you created to save time editing. Can you share? I plan to place it on the current version of the USA Wall Planning chart.
Hi Aaron, I just updated the article with links to my legend. I included a ready-to-use PNG and an editable SVG version. Let me know if you have any problems with the files. Thanks for the great idea!
Ken
This is amazing! I am so excited to build my own! I’m in florida by the space center so I’m right where Jax and Miami meet. Do you have a state map of Florida you can post, please?
Hi George. The Florida Department of Transportation has a really nice Florida chart. I added a link in the article. Here’s the direct link to the page. Click on “Florida Aeronautical Chart – 2025“
Outstanding! Thank you! I am hoping to get started on it this weekend.
Let me know how it turns out!
Is there any reason why you couldn’t use a poster board print from Walgreens, as opposed to using a poster paper print and gluing it to a foam/mat board? I feel like we can skip the gluing step if we print it directly to a poster board, but I’m not sure if there is a reason to not do that.
You could certainly do that!
Hello! Thank you for the tutorial! Can you tell me how you got the lights to illuminate in the LED Legend Thanks!
Hi there! Info for the legend lights can be found here, about halfway down the page:
https://diymetar.com/faq
Short answer: Instead of entering airport codes for the legend lights, enter codes:
L1 = Vfr / Green
L2 = Mvfr / Blue
L3 = Ifr / Red
L4 = Lifr / Pink
L5 = Windy / Yellow
Hope this helps!